Guide · By Danylo Pravda · Updated
Build an analytics dashboard in React
A dashboard is where people decide whether they trust your product's numbers. The usual generated dashboard breaks that trust in small ways: a metric that failed to load shows 0, a chart jumps when its data lands, a percentage change is green when the number that rose is churn. Beamline's analytics dashboard is a SaaS home screen built to avoid each of those. This guide covers what it shows, what you give it, and the parts it is made of, so you can compose a different dashboard from them.
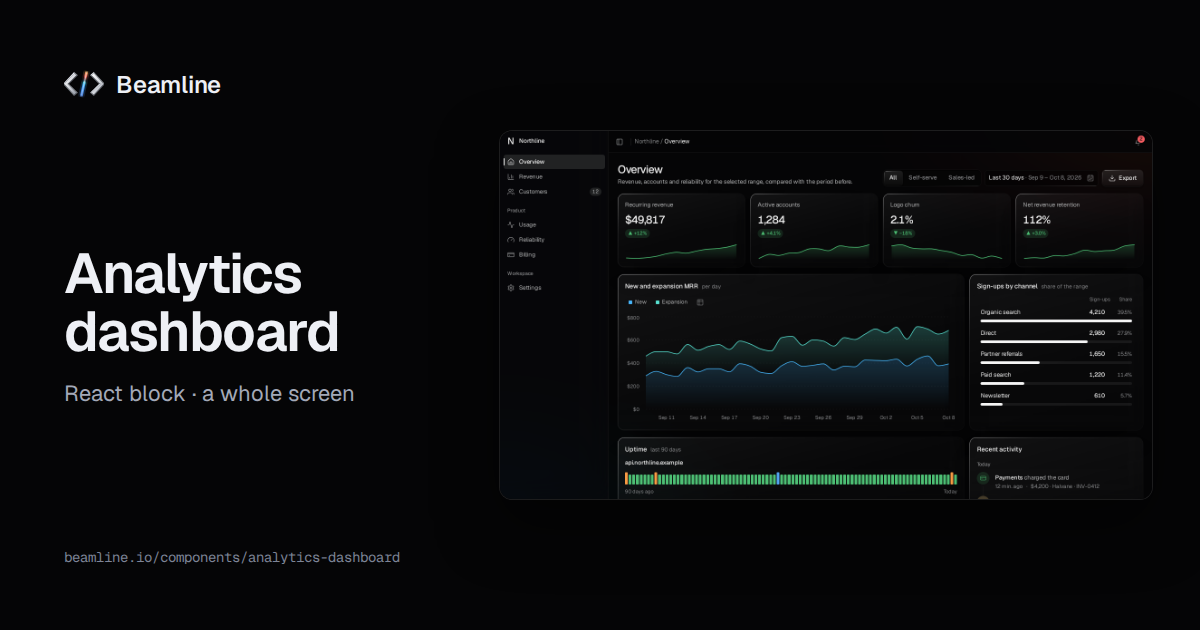
One hook around your metrics API
The dashboard asks one hook for its data, with the range and segment the person picked:
import { AnalyticsDashboard, type UseAnalytics } from "@beamline/analytics-dashboard";

// your data layer, cached by query (React Query, SWR or your own)
const useMetrics: UseAnalytics = ({ range, segment }) => {
  const { data, error, reload } = useCachedRequest(`/api/metrics?segment=${segment}`, range);
  return { data: data ?? null, error, retry: reload }; // null while loading
};

<AnalyticsDashboard
  useData={useMetrics}
  segments={[
    { value: "all", label: "All" },
    { value: "self-serve", label: "Self-serve" },
    { value: "enterprise", label: "Enterprise" },
  ]}
/>
The hook is called on every render with the current query, so cache by query (React Query, SWR or your own). data is
null while loading, and error with retry drive the failed state, which keeps the filters and offers Retry.
What the data looks like
- KPIs: a label, a value, a format and the change against the previous period.
invertmarks a number where a fall is good (churn, latency), so its colour and arrow say good when it drops. - Revenue: new and expansion recurring revenue per day, week or month.
- Channels: sign-ups by acquisition channel.
- Plan mix: the share of active accounts by plan, whole percentages adding to 100.
- Uptime: a service's daily status for the last 90 days, with a summary you measured.
- Activity: recent events for the feed.
Missing is not zero
Every value can be null, and null means "not measured", not 0. A KPI that was not measured for the range is drawn
hatched, a channel that was not tracked shows a hatched bar and "Not measured" in the ranking, and a gap in revenue stays a gap in the
chart. A dashboard that turns a failed query into 0 tells people their revenue collapsed; this one tells them the
number is missing. The same rule runs through every Beamline chart and the metric card.
The parts, if your business is not a SaaS
The block's data is a SaaS's (recurring revenue, plans, uptime). For invoices, orders or bookings, compose the same parts with your own data:
| part | for |
|---|---|
| Metric card | a headline number: the value rolls to each new number, the change has an arrow, a sign and a tone, a trend line and context |
| Area chart | amounts over time, overlapping, stacked or as shares of 100 % |
| Bar list | a ranking: top pages, sources, customers |
| Category bar | one bar split into labelled ranges, such as a plan mix |
| Tracker | a row of status blocks for uptime, job runs or daily checks |
| App shell | the frame: a collapsible sidebar, the top bar and the page |
For exploring rows one by one, the dashboard is the wrong screen: that is the data grid or the CRM block. For live market screens, it is the trading terminal.
Small things it gets right
- Loading keeps the layout still. Metric cards, bar lists, trackers and category bars draw placeholders in their own loaded shape, at their real height, so nothing moves when the data lands.
- Labels never collide. On the plan mix, a boundary label that would touch its neighbour hides, and the ends always show.
- Switching a filter is measured. One click on a segment drives the whole page, so Beamline's speed bench measures that click; a fix in the chart frame halved the React commits it causes, 132 to 70 (the measurements).
- The keyboard reaches everything. Every filter is a native control, ⌘B or Ctrl+B collapses the sidebar, and chart legend items toggle their series with Enter.
Ask your agent for it
With Beamline connected (setup for your agent): "an analytics home for our SaaS on /api/metrics with
range and segment filters, MRR, sign-ups by channel and uptime". The agent installs the block, writes the hook around
your endpoint and maps your fields onto its data, keeping missing values as null.