Guide · By Danylo Pravda · Updated
Build a trading terminal in React
A trading screen is the hardest everyday UI there is: numbers that change several times a second, prices people click to trade at, red and green that must not be the only signal, and an order form where a wrong default costs money. Beamline has eleven trading parts and one whole screen built from them. This guide shows how they fit together on your own data, and what each one already handles.
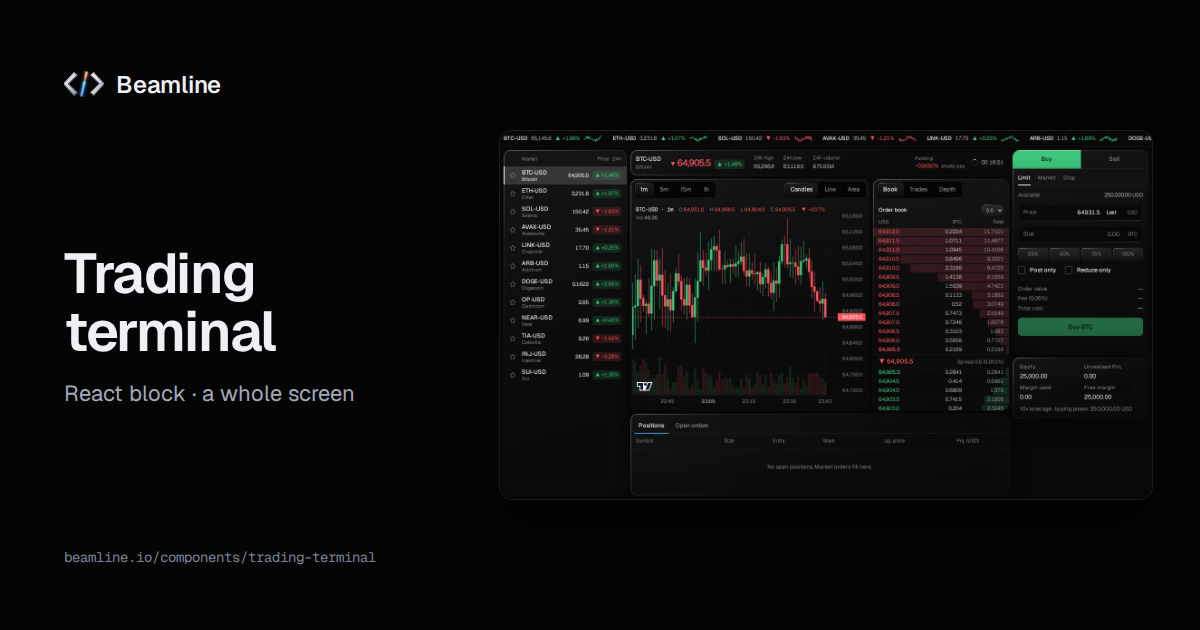
Start from the whole screen
The trading terminal is a perpetuals desk: a ticker tape, a market header with funding, candles, the book, trades and depth, an order ticket, account figures and positions. It arranges itself by its own width, from a four-column desk down to a single phone column where Buy and Sell open the ticket in a sheet. You give it three things:
import { TradingTerminal } from "@beamline/trading-terminal";

<TradingTerminal symbols={tickers} useFeed={useExchangeFeed} account={useExchangeAccount()} leverage={10} />symbols: the markets in the watchlist.useFeed: a hook you write around your exchange stream. It is called once per open market (a new symbol or interval remounts it) and returns the current market on every update.account: your order API, wrapped in one object.
The terminal never fills an order itself. It shows what your feed and your account say, and calls your functions.
Your market feed
The feed is a plain shape, defined in @beamline/lib-market:
interface MarketFeed {
  candles: Candle[];
  bids: Level[]; // [price, size]
  asks: Level[];
  trades: Trade[];
  last: number;
  prev: number;
  change: number;
  funding?: { rate: number; nextAt: number }; // perpetuals only
}
Write the hook around whatever your exchange sends, a WebSocket or polling, and map each message onto that shape:
import { useEffect, useState } from "react";
import type { MarketFeed, UseMarketFeed } from "@beamline/lib-market";

export const useExchangeFeed: UseMarketFeed = ({ symbol, intervalSec }) => {
  const [feed, setFeed] = useState<MarketFeed>({ candles: [], bids: [], asks: [], trades: [], last: 0, prev: 0, change: 0 });
  useEffect(() => {
    const socket = new WebSocket(`wss://your-exchange.example/stream?symbol=${symbol}&interval=${intervalSec}`);
    socket.onmessage = (e) => setFeed((prev) => applyUpdate(prev, JSON.parse(e.data))); // your mapping
    return () => socket.close();
  }, [symbol, intervalSec]);
  return feed;
};
While you build, useMockFeed from @beamline/demo-market-simulator produces the same shape from a random walk, and
usePaperAccount from @beamline/demo-paper-account fills orders against it in the browser. Both are labelled as
simulated wherever they appear, so a demo is never mistaken for a market.
Your orders
The account is your exchange's order API behind one object: the balance, positions, resting orders and fills you hold in state, and three calls.
import type { TradingAccount } from "@beamline/lib-market";

function useExchangeAccount(): TradingAccount {
  const { balance, positions, orders, fills } = useAccountStream(); // your private socket or polling
  return {
    balance, positions, orders, fills,
    submitOrder: async (o) => {
      const res = await api.post("/orders", o);
      return res.filled
        ? { status: "filled", price: res.avgPrice, size: res.filledSize }
        : { status: "resting", order: res.order };
    },
    cancelOrder: (id) => api.delete(`/orders/${id}`),
    closePosition: (symbol) =>
      api.post(`/positions/${symbol}/close`).then((r) => ({ status: "filled", price: r.avgPrice, size: r.size })),
  };
}
A call that fails rejects with an Error, and its message appears in the order ticket as it is. Nothing on screen
claims an order went through until your API says so.
Or compose your own screen from the parts
Every part of the terminal works on its own, with the same data shapes:
| part | what it is for | it handles |
|---|---|---|
| Order book | showing liquidity and picking a price | cumulative depth bars, grouping, change flashes, keyboard price picking (onPriceSelect) |
| Price chart | the main price view | candles, line or area, volume, OHLC legend, reference lines; canvas, so several updates a second stay cheap |
| Order ticket | placing an order | limit, market and stop, % of balance, inline validation, a live cost summary |
| Depth chart | how much size sits within a price range | stepped bid and ask areas around the mid, hover readout |
| Positions table | open positions | live unrealised PnL, liquidation warnings, close actions |
| Trades tape | recent trades | newest first, side glyphs, large prints marked, one flash on arrival |
The rest of the set: watchlist, price ticker, ticker tape, market heatmap and funding countdown. Each part's page says when to use something else: the order book is for picking a price, the depth chart for seeing size over a range; business metrics over time belong in a line chart, not the price chart.
What the parts do that is easy to get wrong
- The keyboard trades too. The book's rows are one tab stop; arrow keys, Home and End move, Enter or Space sends the price to the ticket. The ticket's side is a radio group and its type a tab list, each one tab stop.
- Colour is never the only signal. The book's last price carries ▲ or ▼ as well as green or red, and the trades tape marks each side with a glyph, so a colour-blind trader and a grey-scale screenshot read the same thing.
- Flashes happen once. A changed size flashes once and settles; nothing pulses at rest, so a quiet market looks quiet.
- Stale data says so. The book takes a
staleflag that puts your chip in its header while the levels stay readable and pickable, instead of silently freezing. - Missing is not zero. A market with no data draws as unmeasured (hatched) in the heatmap, never as a flat 0 %.
Ask your agent for it
With Beamline connected (setup for your agent), ask for the screen and name your data: "a BTC and ETH perpetuals screen on our WebSocket feed at wss://…, orders through our REST API". The agent installs the terminal and the parts it needs, writes the feed hook and the account around your API, and keeps the demo feed only where you ask for one. The data shapes are documented in Connect your data.